Big Visualization: Dropdown Menu
Displaying Big Data in Complex Visualizations can Simplify the Takeaway
Technological advances in the last 15 years have increased our ability to collect and analyze large amounts of data in more efficient and cheaper ways. This has resulted in the boom of “big data”—data sets that have increased volume, velocity, and variability. Volume refers to the amount of data being collected, velocity refers to the speed at which data is collected and used, and variety refers to the increasing types of data collected. All of these factors increase the generalizability of your results. However, the most common current data visualization techniques are not able to capture the complexity of interactions in big data sets. Simple changes in color and contrast, the amount of data displayed on the figure, and the range of the figure axes can make a huge difference in improving your data displays.
This article will highlight how the amount of data displayed on the figure can change how your reader interprets your data.
Part of the appeal of big data is that the data is more representative of the population from which it is collected because of the sheer amount of information. However, presenting all of the data at once can easily lead to information overload. This occurs when the amount of information presented exceeds the processing power of the people looking at it. Rather than dumbing down your data, potentially leading to a loss of specificity and nuance, which are the primary reasons large amounts of data are collected in the first place, adding a dropdown menu allows the reader to pick out specific aspects of the data that interest them.
For example, looking at data showing antibiotic prescription rate per 1000 people by state over time, there is a lot to see all at once. Presenting all of this data at the same time allows readers to get a general idea of the trends over time, but it is nearly impossible to pick out individual states that people might be more interested in.
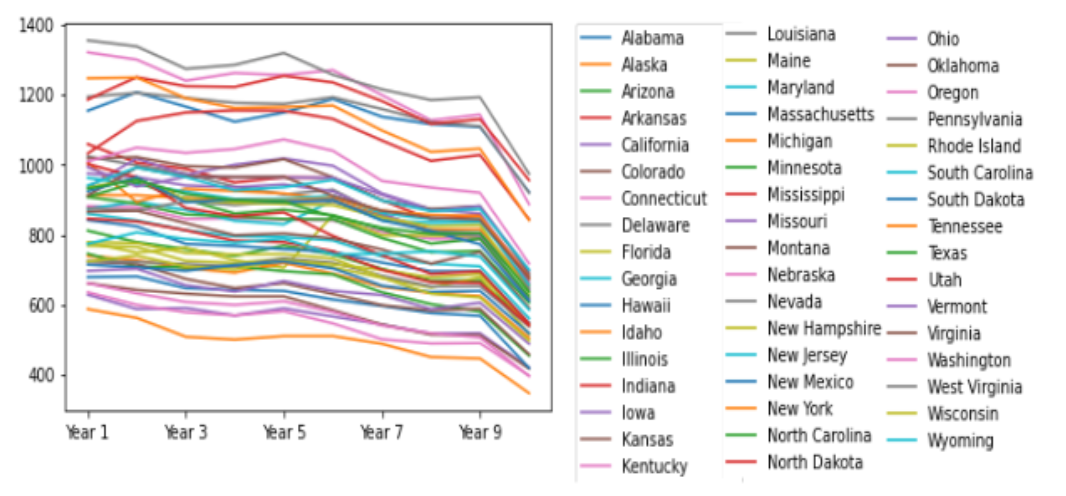
Adding a dropdown menu does two important things for this data; it adds an interactive element that will engage people because they will likely want to look at their state data and compare it to other states, and it allows the data to be subset and analyzed in specific ways, without losing the overall data set.
There are multiple ways to add a dropdown menu to your graph, using different python packages. I used the Plotly graph object module, because it allows me to update the figure once it has been created. What that means is that I can make the initial line plot as seen above, and then define what the dropdown menu will contain before adding it to the figure.
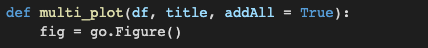
First, I created a function that defines the graph, and set it equal to the empty figure "go.Figure()."
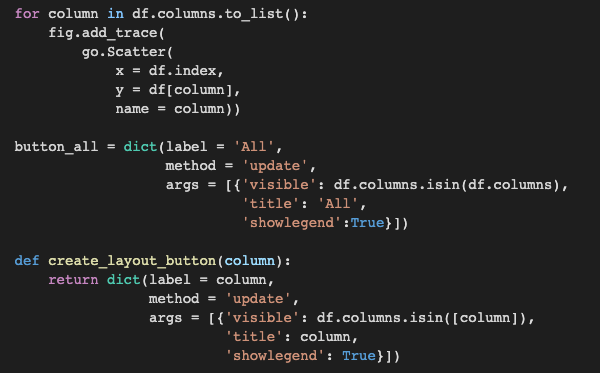
To actually create the figure, I used a for loop that iterates through all of the states in my data set. Using the graph object ("go") attribute "Scatter", "go.Scatter()," I made the graph you see above in this article. Next, I defined what goes in the dropdown menu button in the "button_all" function. The menu is a dictionary, meaning that each key, in this case each state, is associated with a given value or set of values, in this case antibiotic prescription rate over time. You can call any key and it will return the associated values. Before adding this button to the figure, I first created a function that attached the dictionary values to the button and set the layout.
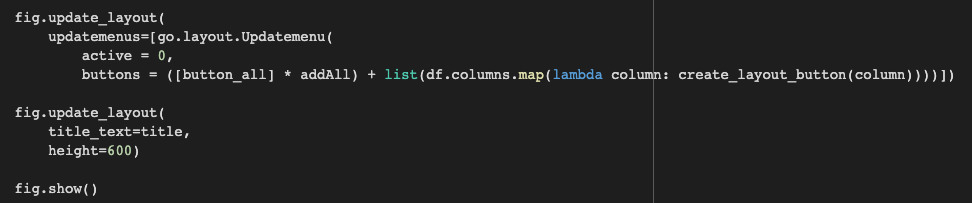
The final step is to add the button to the figure. This is why creating the figure as a graph object is so useful; you can update the figure after it has been created the way you want and add features without disrupting any other aspect or having to redo the code to create the figure. Once the layout has been updated, the last step is to show your new figure!
See the full code for adding a dropdown menu to your figures here.
For experts, interactive elements allow them to get a more nuanced understanding of the data and all of the trends and connections that can be seen. For non-experts, interactive elements allow them to dynamically engage with the data in ways that make it more interesting to them, increasing the likelihood that they will seek out and understand new research. Complex visualizations can target both audiences at once, making your data accessible and interesting to a much wider audience.
When analyzing big data, use big visualizations to match the power of your data!
Post a comment